
Customized Reports
Having the ability to run reports on the data you need is essential in today’s business landscape. The report engines built throughout the system allow you to do just that.
Simpletrak 2.0 has report features for each module. Dashboards can be converted into reports along with records that can be quickly filtered and queried, so you get the exact report you need when you need it. Some of the report’s features include Calibration, Maintenance, Supplier Ratings Scorecards, Customer Feedback, Internal Audit, Management Review, Ontime Delivery, Quality Ratings, Internal Rejection, Labor Efficiency, and Cost Efficiency.

Benefits
Having data collected in real time enables you to run accurate reports at the click of a button. With the system’s dynamic report builders, you’ll know where you’re at and be able to see key information which will identify areas that need your attention. With today’s ever-changing requirements, Simpletrak’s dynamic reporting will help you control your business and make better decisions.
Key Features
 Dashboards
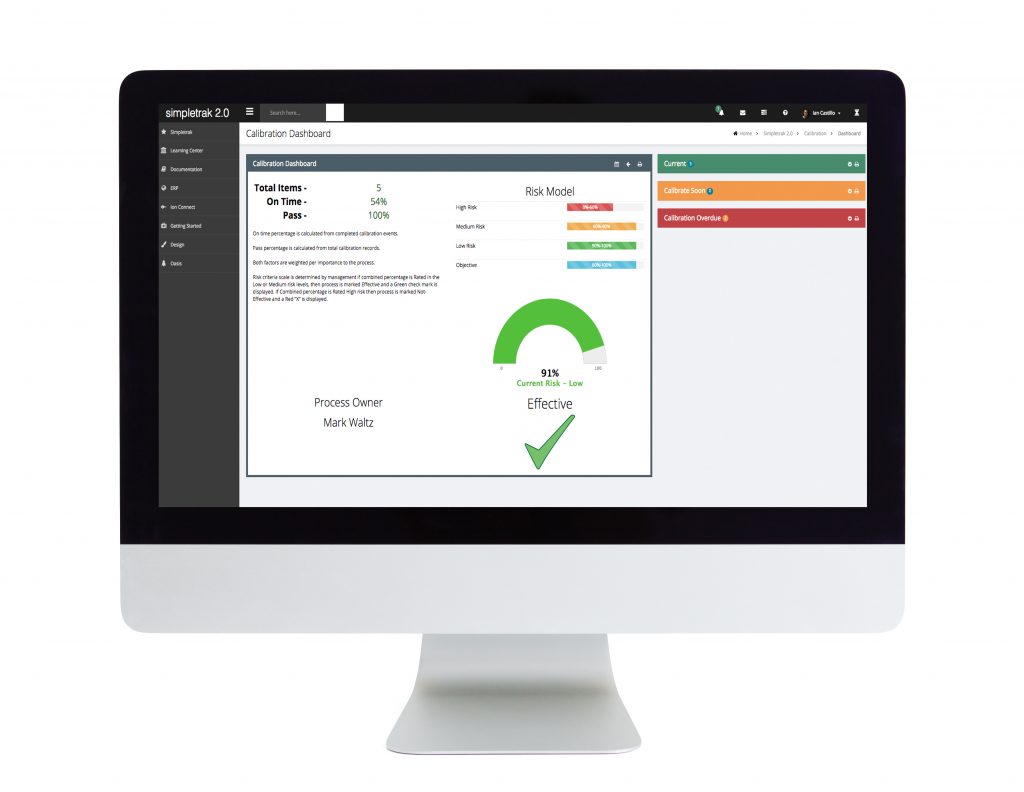
Identify key objectives and see where your company is at in relationship to them. All dashboards come with customizable risk models that help you establish where you’re at by the records you have collected. Quickly convert dashboards into a printable report for distribution if needed.
 Module Records
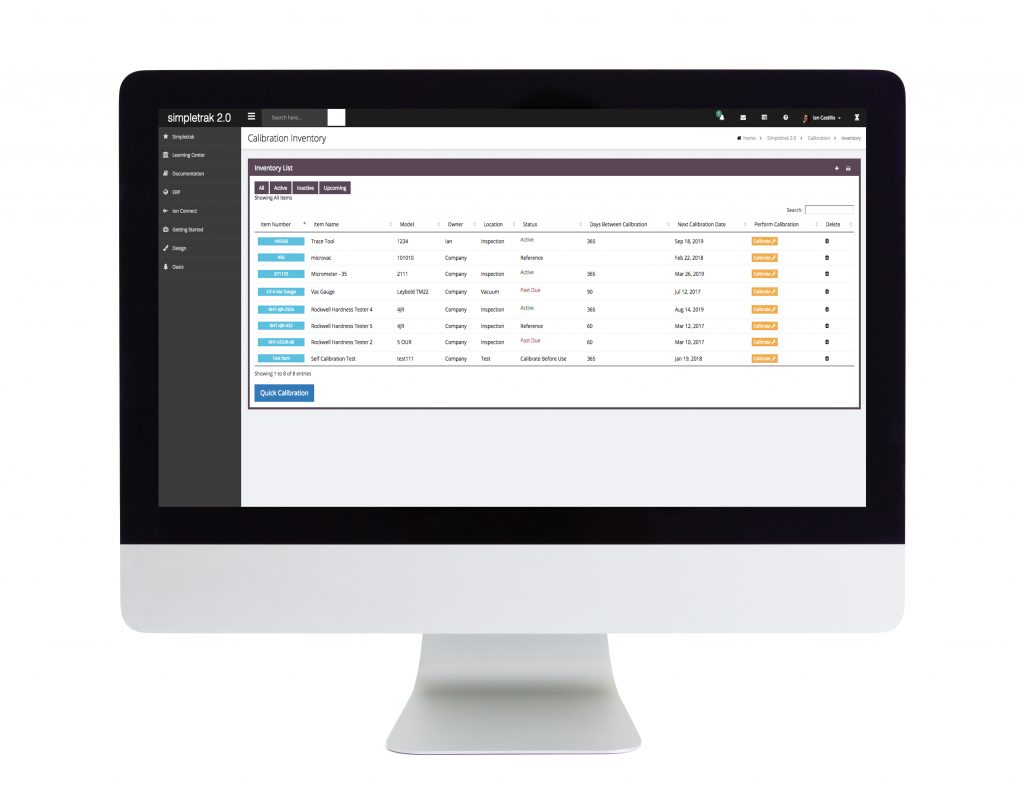
All modules come with report builder filters to help you identify what record parameters you’re looking for. Once the query has been applied, simply print the individual record, or the full report.
 Management Dashboards
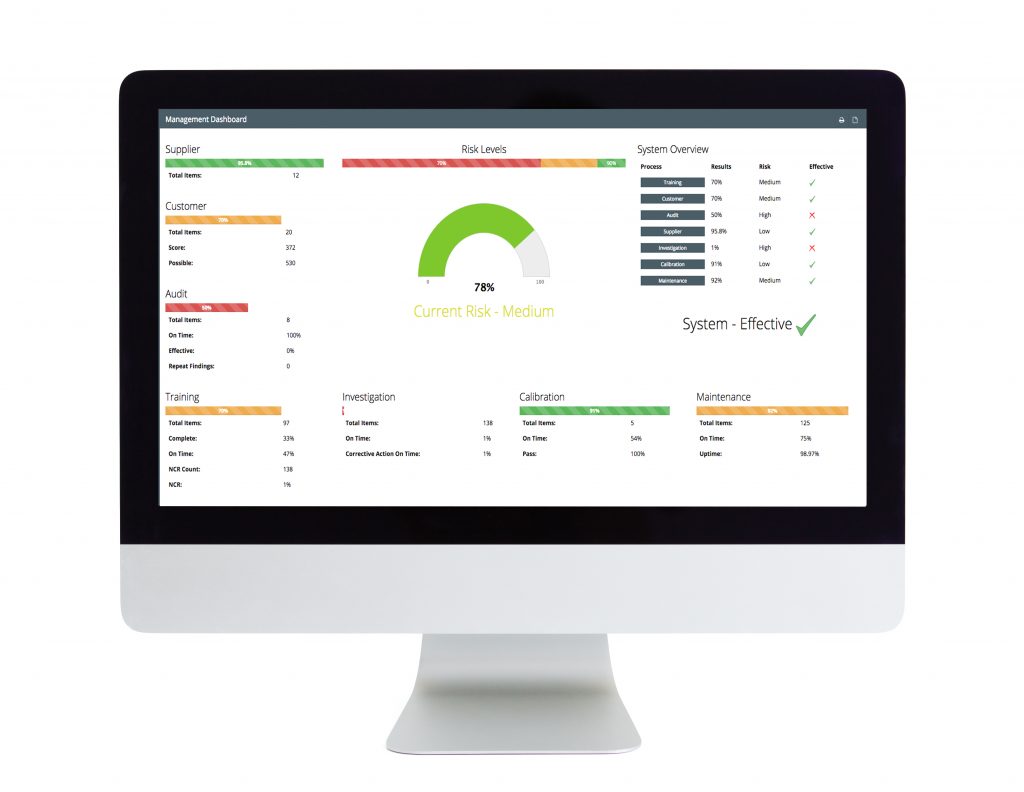
Combine all processes into one measurable report. The QMS Management Dashboard allows you to weight your modules so you can identify which feature has the greatest impact on your system. This report then calculates the effectiveness of your entire system as a whole, giving you the ability to validate your data and help you strive for continuous improvement.
The ERP Management Dashboard enables you to see your processing efficiencies and breaks them out into measurable KPI’s such as On-Time Delivery, Quality Rating, Internal Rejects, Labor Efficiencies, Cost Efficiencies, Sales Volume, Top Customers, Jobs by Industry and finally an overall thirty-day capacity. Each section can be trended and reported on with the click of a button.
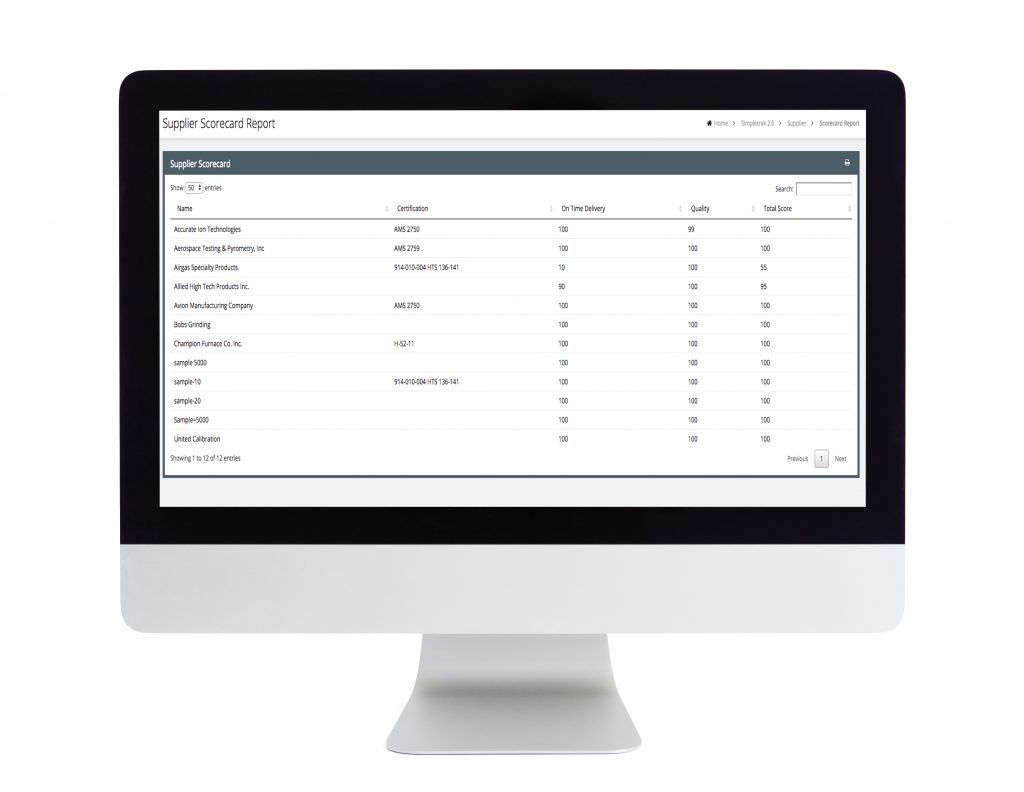 Supplier Ratings

Retrieve valuable data through the Suppliers Dashboard and Supplier Scorecard reports. Know how your entire supply chain is performing by analyzing on-time delivery and supplier quality as a whole, or by the individual supplier. Identify a problem supplier before you issue them another order.
Track, trend, and analyze NCR and Corrective Action data with the intuitive report building tools. Insert multiple charts or trend data from a variety of information collected from your investigations. Use this information to stop making costly mistakes and drive continuous improvement.